


Were you involved in an accident?
833-4-ACCIDENT
833-422-2433
Claim Calculator
Quick calculation

Source: Photo by Clive Kim, Pexels
Car accidents in New York City in 2024. New York City Traffic Accident Statistics 2024
New York City, the most populous city in the United States, also boasts some of the worst roads in the country.
According to INRIX Global Traffic Scorecard, New York was ranked the worst city for the traffic in the United States in 2024, followed by Chicago, Illinois and Los Angeles, California.
If you drive a car in New York, it’s brutal, there’s no question about it.
Unsurprisingly, the combination of a densely populated city and heavy traffic leads to a significant number of car accidents, including fatalities and accidents with serious injuries.
Our team has done a detailed analysis of:
- NYPD crash data
- NYPD Motor Vehicle Collisions page (updated weekly)
- Vision Zero View (updated monthly),
- NYPD Traffic Collision Statistics
- Non-Injury Vehicle Collisions
Additionally, you can find here the interactive map of the car accidents in New York City with car crash fatalities and the Database that tracks every traffic crash / car accident resulting in serious injuries in New York City prepared by Transportation Alternatives and Families for Safe Streets.
Injured in a Crash? Get free estimation of your compensation and call our lawyers for a Free Consultation
(833) 4- ACCIDENT or (833) 422-2433
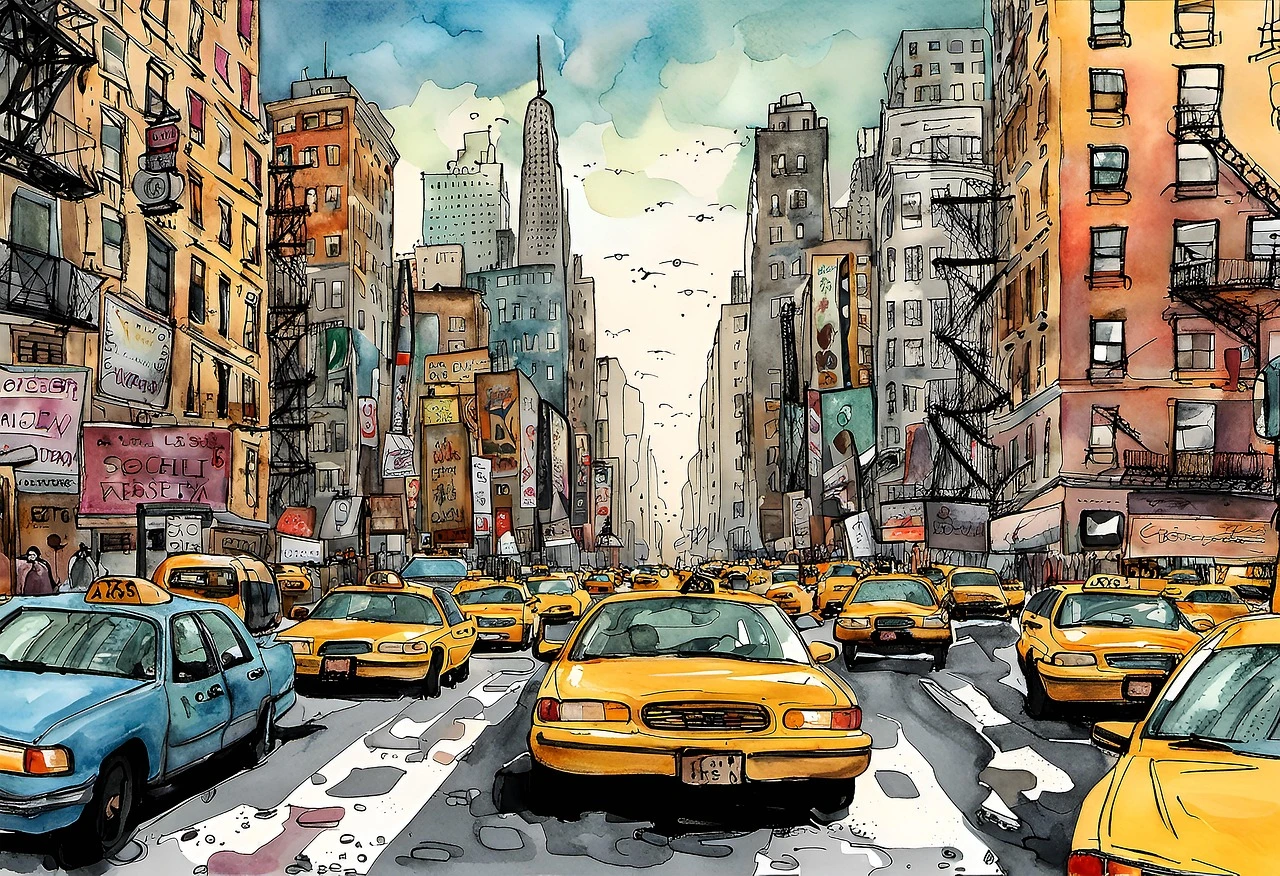
Image by Geralt, Pixabay
Below is a brief summary of the key insights about car accidents in New York City in 2024.
First of all, during the first nine months of 2024, traffic crashes killed 193 people and seriously injured another 2,338 people. This is more fatalities than during eight of the last 10 years, and this public health crisis has cost New Yorkers more than $5 billion in 2024
The Office of the New York State Comptroller Thomas P. DiNapoli has published the Report “Motor Vehicle Fatalities Rise Sharply in NY” in June of 2024.
The report states that the federal government has allocated about 641 million dollars to New York City over 5 years for the the Highway Safety Improvement Program to improve road safety.
The enacted budget for the NYS Fiscal Year 2024-25 allows New York City to reduce the speed limits. DiNapoli’s report urges policymakers to consider giving more local governments the ability to adjust their minimum speed limits to help reduce car accidents in New York City and traffic fatalities in NYC.
Which Boroughs in New York City Have the Most Accidents?
BROOKLYN
Brooklyn has the highest number of car accidents in New York City and ranks among the areas with the most traffic accidents statewide.
Key Facts About Car Accidents in Brooklyn:
- Accident Frequency: Brooklyn experiences more car accidents than any other borough, followed by Queens.
- Accident Severity: Car accidents in Brooklyn tend to be more severe compared to those in other boroughs.
- Injury-Related Deaths: Car accident injuries rank as the fifth leading cause of injury-related deaths in Brooklyn.
- Injury-Related Hospitalizations: These injuries are the third leading cause of injury-related hospitalizations in the borough.
- Common Causes: Driver inattention and distraction are frequent contributing factors in these accidents.
Contributing Factors to Brooklyn's High Accident Rate:
- Dense Population: Brooklyn’s densely populated neighborhoods increase the likelihood of collisions.
- Numerous Intersections: The borough's many crossroads create high-risk areas for accidents.
- Heavy Traffic Volumes: Brooklyn's consistently high traffic levels contribute to the frequency of crashes.
Improved safety measures, better traffic management, and public awareness are essential to reducing accidents and their severe outcomes in Brooklyn.
THE BRONX
Meanwhile, the new study shows that the rate of serious injuries per capita from traffic crashes in the Bronx is 20% higher than citywide. Compared to last year, serious injuries from traffic collisions in the Bronx rose 10%.
Bronx residents are more likely to be in a traffic crash than New Yorkers who live in any of the other boroughs.
QUEENS
Recent data shows that Queens ranks third among New York City boroughs for car accident fatalities, trailing Brooklyn and the Bronx but ahead of Manhattan and Staten Island. A substantial portion of the city's total crashes occur within Queens' boundaries.
Key Facts About Car Accidents in Queens:
- Percentage of NYC Crashes: Queens accounts for approximately 24.9% of car accident fatalities in New York City.
- Comparison to Other Boroughs: Brooklyn leads with the highest number of car accidents, followed by the Bronx, with Queens ranking third.
- Vision Zero Initiative: The city, including Queens, is working to reduce traffic fatalities through the "Vision Zero" program, aiming to eliminate traffic-related deaths and injuries.
Efforts to enhance traffic safety in Queens remain crucial, given its significant share of the city's accidents.
MANHATTAN
Manhattan ranks fourth among New York City boroughs for car accidents, with Brooklyn, Queens, and the Bronx reporting higher numbers.
Key Points About Car Accidents in Manhattan:
- Accident Frequency: Manhattan experiences a significant number of car accidents, though fewer than Brooklyn and Queens.
- Pedestrian Fatalities: Despite having fewer overall accidents, Manhattan records a notable number of pedestrian fatalities resulting from car crashes.
These statistics highlight the need for targeted safety measures to address pedestrian risks and improve traffic safety in Manhattan.
STATEN ISLAND
Staten Island has the fewest car accidents in New York City. This is because it has the lowest population and the least congested roads.
New York City Car Accidents Statistics 2024


0 comments